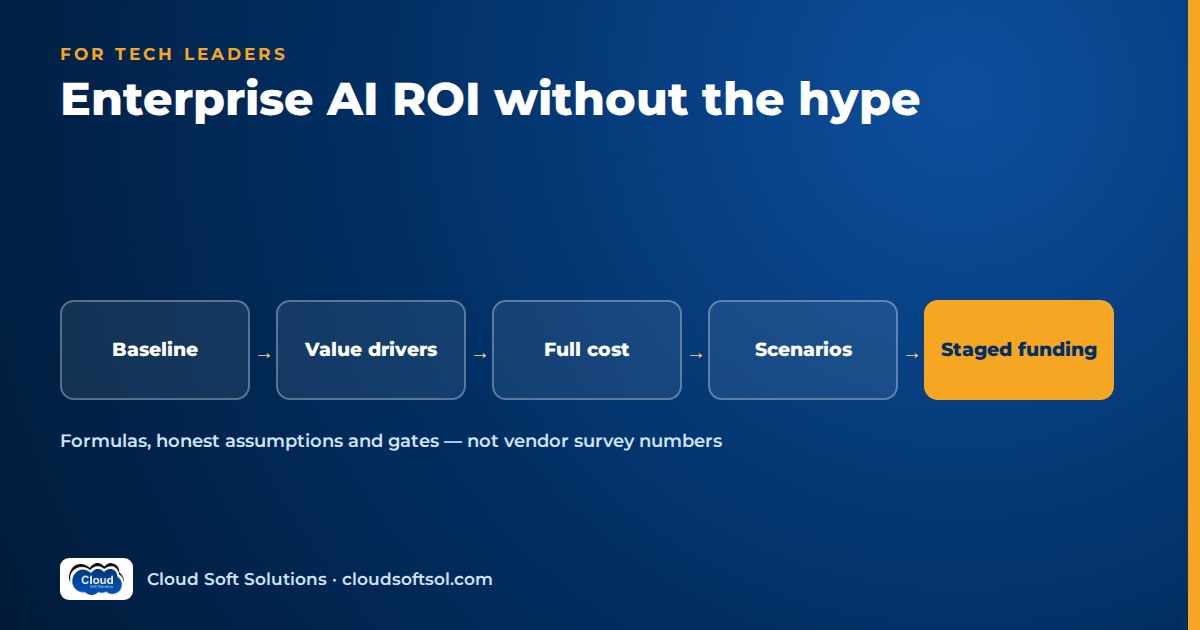
Most AI business cases fail in one of two ways: they promise a number nobody can later find in the accounts, or they are so vague that finance cannot fund them. A credible enterprise AI ROI case measures a baseline before anything is built, counts every cost (including the people who review AI output), converts benefits to cash only where cash actually moves, shows a conservative and an expected scenario, and asks for money in stages tied to evidence. This guide gives leaders and Forward Deployed Engineers the formulas, a one-page template and an illustrative support-team example. It quotes no industry ROI figures, because your number is the only one that matters, and every number below is labelled illustrative.
If you are still choosing which problem to solve, start with how to find and prioritise enterprise AI use cases; this article assumes you have a candidate and need to justify it.
Why most AI business cases fail the CFO test
A finance team reads a business case looking for three things: where the money goes, where the money comes back, and how they will know. AI proposals tend to answer the first loosely and the second with optimism. Typical red flags:
- "Saves N hours a month" with no statement of what happens to those hours.
- A cost line that is only the model or licence fee.
- No baseline, so any improvement after launch is an assertion.
- One point estimate presented as a forecast.
- Benefits that depend on adoption, with no plan or budget to get adoption.
Forward Deployed Engineers sit close to this conversation because they are the people who own a use case from discovery to measured result (see how enterprises use FDE teams to deliver AI outcomes). The business case is not a document written once for approval; it is the measurement plan the delivery team will be held to.
The six types of value, and what each really means
Group benefits by type, because each type converts to money differently and carries a different level of certainty.
| Value type | What you measure | How it becomes money | Certainty |
|---|---|---|---|
| Time saved | Minutes per task, before and after, net of review | Only via avoided hiring, reduced overtime or contractors, or redeployed capacity that produces something valued | Medium; often overstated |
| Throughput | Tasks completed per person or per day; backlog age | Revenue that was capacity-limited, or a backlog cleared without extra staff | Medium to high if demand exists |
| Quality / error reduction | Rework rate, reopen rate, defect or exception rate | Avoided rework hours, refunds, write-offs, penalties | High when errors already carry a cost |
| Revenue | Conversion, response time to leads, cross-sell acceptance | Incremental margin, not incremental revenue | Low to medium; hardest to attribute |
| Risk reduction | Missed compliance checks, unreviewed contracts, policy breaches found | Expected loss avoided (probability multiplied by impact) | Low precision; state as a range |
| Employee and customer experience | Satisfaction scores, attrition, effort scores, wait time | Indirect: retention, reduced hiring cost, loyalty | Low; usually kept non-financial |
What really happens to saved time
Time saved is the most common benefit and the most abused. If an AI drafting assistant saves each claims handler a few minutes per claim, those minutes scatter across the day. Nobody goes home early and payroll does not change. Saved time becomes value in only a few ways: the team absorbs growth without hiring, overtime or contractor spend falls, a backlog that was costing money shrinks, or people are deliberately moved to higher-value work that someone can name. If none of those is planned, the honest financial value of the time saved is close to zero, even if the experience value is real.
That is why the formulas below include a realisation factor: the fraction of saved time you have a specific plan to convert.
The full cost picture
The model or API bill is often a minority of the total. A complete cost view has one-off and recurring lines:
| Cost line | One-off or recurring | What it includes |
|---|---|---|
| Build | One-off | Discovery, design, engineering, security review, test data preparation |
| Model / API usage | Recurring | Input and output tokens, embeddings, reranking; grows with volume and context size |
| Infrastructure | Recurring | Compute, vector store, storage, networking, environments for dev and test |
| Integration | Both | Connectors to CRM, ticketing or core systems; API changes on the other side |
| Evaluation and monitoring | Recurring | Evaluation sets, regression runs, judge-model calls, tracing, log retention |
| Human review time | Recurring | Minutes people spend checking, correcting or approving AI output |
| Change management | Mostly one-off | Training, process redesign, communications, champions, time away from work to learn |
| Maintenance | Recurring | Prompt and retrieval tuning, data refresh, bug fixes, on-call, product ownership |
| Model upgrades | Periodic | Re-running evaluations when a model version is retired or replaced, prompt rework, re-embedding |
Two lines deserve emphasis. Human review is a cost, not a free safeguard: if every AI draft needs a careful read, review minutes eat directly into the minutes saved. Designing where review is needed and where it is not is covered in our guide to human-in-the-loop AI design. Model upgrades are certain over a multi-year horizon, because providers retire versions; budget for an evaluation-and-rework cycle each time. For estimating usage and infrastructure lines properly, use the cost-per-task model in cloud cost optimization for AI rather than a price-per-token guess.
Baselines: measure before you build
Without a baseline, there is no ROI, only a story. Before the first prompt is written, capture the current state of the metrics you intend to move, for long enough to see normal variation (seasonality, month-end peaks, staffing changes).
- Volume: tasks per period, by type.
- Effort: handling time per task, from system timestamps where possible, time studies where not.
- Quality: rework, reopen, error or escalation rates, and how they are defined.
- Outcome: the business metric the sponsor cares about, such as backlog age, resolution time or customer satisfaction.
- Cost: loaded cost per hour of the people involved, agreed with finance rather than guessed.
Agree metric definitions in writing with the sponsor and finance.
The formulas, with placeholders
Keep the arithmetic simple enough that a finance analyst can rebuild it in a spreadsheet. Work per month, then roll up.
Net time saved per task
  = (T_before - T_after) - T_review

Time value / month
  = Volume x Net time saved x (1/60)
    x Loaded cost per hour x Realisation factor

Quality value / month
  = Errors avoided x Cost per error

Run cost / month
  = Volume x Cost per task (model + infra)
    + Platform, eval, monitoring
    + Maintenance and ownership people

Net monthly benefit
  = Time + Quality + Other value - Run cost

One-off cost
  = Build + Integration + Change management

Payback (months) = One-off cost / Net monthly benefit
ROI over horizon
  = (Net monthly benefit x Months - One-off)
    / One-off
Notes on the placeholders:
- T_after must be measured on real work in a pilot, not estimated from a demo.
- Realisation factor is between 0 and 1 and should be justified by a named plan (hiring avoided, overtime cut, backlog work).
- Cost per error should come from finance or operations records, not intuition.
- Choose a horizon that matches how long the system is expected to run before a significant rebuild, and keep it short enough to be believable.
Sensitivity and scenarios
A single number invites false confidence. Build at least two scenarios:
- Conservative: lower time saved, higher review time, lower adoption, lower realisation, higher run cost.
- Expected: the values you believe are most likely, based on pilot data where you have it.
Then run a simple sensitivity check: change one input at a time and see which ones swing the answer. In most AI cases the decisive inputs are adoption, review time and realisation factor, not token price. Whatever moves the result most is what your pilot must measure first. If the conservative case is negative, say so; it tells the CFO exactly what the next stage of funding is buying, which is evidence on those inputs.
Attribution pitfalls
Business metrics move for many reasons. Before claiming the AI moved them, rule out the usual confounders:
- Seasonality and mix: ticket or claim volumes and difficulty change through the year.
- Concurrent changes: a process redesign, new hires or a product fix launched at the same time.
- Selection bias: early adopters are often your strongest performers; their results do not generalise.
- Novelty effect: usage and care are high in the first weeks and then settle.
The strongest defence is a comparison group: roll out to some teams or queues first and compare against similar ones that have not yet received it, over the same period. Where that is impossible, compare against the baseline period and document every other change that happened.
Leading vs lagging indicators
Financial benefit is a lagging indicator; it shows up months later. Fund and steer on leading indicators that predict it.
| Leading (weeks) | Lagging (months) |
|---|---|
| Active users and frequency of use | Handling time and cost per task |
| Acceptance rate of AI drafts or suggestions | Overtime, contractor or hiring spend |
| Edit distance or correction rate on AI output | Rework, reopen and error rates |
| Evaluation scores on a fixed test set (see LLM evaluation) | Customer and employee satisfaction |
| Escalations and user-reported bad answers | Revenue or margin effects |
Leading indicators come from instrumentation, so tracing and usage capture must be in the build, not added later; our AI observability guide covers how. Adoption itself is not automatic, and the work of earning it is described in enterprise AI adoption and change management.
A one-page AI business case template
Fit the case on one page, with the spreadsheet behind it.
- Problem and owner: the task, who owns the outcome, why now.
- Baseline: current volume, effort, quality and cost, with the measurement period.
- Proposed change: what the AI does, where humans review, what it is not allowed to do.
- Value hypotheses: each value type with its metric and how it converts to money (or why it stays non-financial).
- Full costs: one-off and recurring lines from the table above.
- Scenarios: conservative and expected net monthly benefit, payback and the inputs behind each.
- Key assumptions and sensitivities: the two or three inputs that decide the outcome.
- Risks: data, security, quality, adoption and dependency risks, with mitigations.
- Measurement plan: leading and lagging indicators, comparison group, review cadence.
- Funding request by stage: what each stage costs, what it must prove, and the decision at each gate.
Presenting to CFOs: honesty and staged funding
CFOs are not hostile to uncertainty; they are hostile to hidden uncertainty. Name it. Say which inputs are measured and which are assumed, and show what happens if the assumptions are wrong.
Then ask for money in stages, each with a gate the next tranche depends on:
Stage 1: Discovery + baseline
  gate: metric agreed, baseline captured
Stage 2: Pilot on real work
  gate: net time saved and quality measured
Stage 3: Limited rollout + comparison group
  gate: adoption and run cost per task proven
Stage 4: Scale
  gate: lagging metric moved, owner in place
This mirrors the engineering stage gates in how FDEs take AI from POC to production, which keeps finance decisions and engineering readiness aligned. Stopping at a gate is a success of the process, not a failure of the team: it limits loss to the cost of the evidence.
If your engineers and product owners need to build these skills together, Cloudsoft's corporate training for AI engineering teams can be built around a use case close to yours, from baselining and evaluation to cost-per-task measurement on AWS, Azure or Google Cloud.
Illustrative example: a support team's AI drafting assistant
All numbers in this section are illustrative, chosen to show the method. They are not benchmarks and do not describe any real organisation.
Consider an insurer's customer support team in a Hyderabad GCC that handles policy and claims queries. The proposal is an assistant that retrieves policy documents and drafts replies, which agents review and send.
Illustrative baseline: 20,000 tickets a month, average handling time 12 minutes, loaded cost ₹600 per agent hour (figure agreed with finance).
| Illustrative input | Conservative | Expected |
|---|---|---|
| Net time saved per ticket (after review) | 2 min | 3 min |
| Realisation factor | 0.3 | 0.5 |
| Time value per month | ₹1,20,000 | ₹3,00,000 |
| Model + infra cost per ticket | ₹5 | ₹4 |
| Usage cost per month | ₹1,00,000 | ₹80,000 |
| Platform, evaluation, monitoring per month | ₹40,000 | ₹40,000 |
| Maintenance and ownership per month | ₹1,00,000 | ₹1,00,000 |
| Net monthly benefit | −₹1,20,000 | ₹80,000 |
Check the expected column: 20,000 tickets × 3 minutes = 1,000 hours; × ₹600 × 0.5 realisation = ₹3,00,000. Recurring costs total ₹2,20,000, leaving ₹80,000 a month. With an illustrative one-off cost of ₹12,00,000 (build, integration and change management), payback in the expected case is 15 months.
The conservative case loses money every month. That is not a reason to hide it; it is the most useful line in the case. It shows that the decision hinges on net minutes saved after review and on whether the operations head will actually hold back planned hiring (the realisation factor). So Stage 2 funding buys a pilot that measures exactly those two things, and the team agrees in advance that if net time saved stays near the conservative value, they stop or redesign, for example by limiting the assistant to ticket types where drafts need little editing.
Benefits deliberately left out of the money columns, but tracked: reopen rate, new-agent ramp-up time and customer satisfaction. If they move, they strengthen the next gate's case without having inflated this one.
Common mistakes
- Counting saved minutes as cash. Without a realisation plan, minutes saved are capacity, not savings.
- Ignoring review cost. Measuring time saved on drafting while ignoring the time to check the draft.
- Measuring on the demo. Timings from curated examples rather than the messy real queue.
- No baseline. Starting measurement on launch day.
- Revenue instead of margin. Claiming the full value of a sale the AI influenced.
- Forgetting the long tail of cost. Maintenance, model upgrades and an owning team after the project ends.
- Budgeting zero for adoption. Assuming usage follows deployment.
Frequently asked questions
How do you calculate enterprise AI ROI?
Measure a baseline first, then calculate net monthly benefit as the financial value of time saved (net of review and multiplied by a realisation factor), quality gains and other value, minus recurring run costs. Divide one-off costs by net monthly benefit for payback, and show conservative and expected scenarios.
Is time saved by AI a real saving?
Only when it converts into something finance can see: hiring avoided, overtime or contractor spend reduced, a costly backlog cleared, or people moved to named higher-value work. Otherwise it is extra capacity, which may be valuable but is not cash.
What costs are usually missing from an AI cost benefit analysis?
Human review time, evaluation and monitoring, integration upkeep, change management, ongoing maintenance and ownership, and the rework needed when a model version is retired or replaced.
How do you measure generative AI ROI when quality is hard to quantify?
Translate quality into existing operational costs where possible, such as rework hours, reopened tickets, refunds or penalties. Track the rest, such as satisfaction, as non-financial indicators instead of forcing a money value onto them.
How long should the baseline period be?
Long enough to capture normal variation in volume and difficulty, including peaks such as month-end. Agree the measurement period and metric definitions with the sponsor and finance before building.
What is a realisation factor in an AI business case?
It is the fraction of saved time, between 0 and 1, that you have a specific plan to turn into financial value. It stops a business case from counting every saved minute as cash.
How should AI projects be funded?
In stages, each tied to a gate: discovery and baseline, a pilot on real work, a limited rollout with a comparison group, then scale. Each stage releases funding only when the previous one has produced the evidence it promised.
Building the business case is part of engineering an AI system, not paperwork before it. If you are preparing a team to run AI use cases end to end, talk to Cloudsoft about corporate AI training built around project work and your own stack, in Ameerpet or live online. Individual engineers who want the full delivery path, from discovery and baselines to deployment, evaluation and measured business outcomes, can explore Cloudsoft's FDE PRO program, a 12-week course with a weekly Customer Engagement Lab and the GlobalBank capstone. Call +91 96660 19191 for a free demo.