AI observability is the practice of recording what an AI application actually did on every request, not just whether the server responded. For an LLM application or agent, that means a trace per request that captures the prompt version, model, retrieved chunks, tool calls, tokens, latency per step, cost, guardrail events and user feedback, plus dashboards, SLOs and alerts built on those signals, so you can explain any bad answer and catch quality or cost drift before users do. This guide covers what to capture, which tools to use, how to alert and how to debug a bad answer step by step.
Why AI apps need more than standard APM
Application performance monitoring (APM) was built for systems where a failed request looks like a failure: a 500 error, a timeout, an exception in the logs. LLM applications fail differently.
- Quality is not an HTTP status. A RAG assistant that confidently cites last year's leave policy returns a perfectly healthy 200 OK in a normal latency band. Every APM dashboard is green while the business is getting wrong answers.
- Non-determinism. The same input can produce different outputs on different runs. To explain a complaint you need the exact prompt, context and parameters used at the time.
- Multi-step agents. An AI agent may plan, retrieve, call several tools and loop before answering, so the root cause of a bad answer is often several steps before the final model call.
- Cost is per request and variable. Token usage depends on prompt length, retrieved context and agent loops, so a small prompt change can raise spend without any change in traffic.
You still need platform metrics. AI observability adds a semantic layer on top: what the model saw, what it did and whether the result was any good. Several of the failure modes in why AI demos fail in enterprise production are, at heart, observability gaps: the team simply could not see what was going wrong.
Observability records what happened; evaluation scores whether it was good. The metrics themselves are covered in our guide to LLM evaluation; this article is about the plumbing that makes those scores possible in production.
What to capture on every request
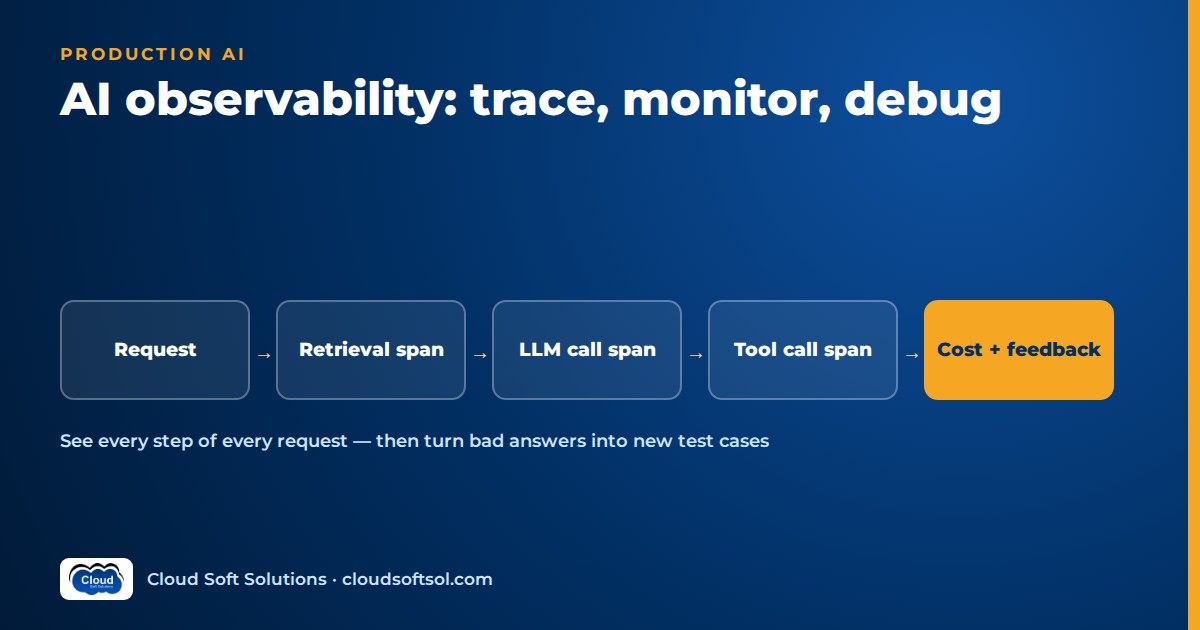
The unit of AI observability is the trace: one end-to-end record of a request, made of nested spans for each step (retrieval, model call, tool call, guardrail check). Attach the following to the trace or to the relevant span.
| Signal | Where it lives | Why you need it |
|---|---|---|
| Prompt / template version | Model-call span | Ties every answer to the exact prompt that produced it; essential when comparing before and after a change |
| Model and parameters | Model-call span | Provider, model identifier, temperature, max tokens; explains behaviour shifts after a model update |
| Retrieved chunks | Retrieval span | Document IDs, chunk IDs, similarity or rerank scores, index version and filters applied; most bad RAG answers start here |
| Tool calls | One span per tool call | Tool name, arguments, result or error, retries; shows what an agent actually did |
| Tokens in / out | Model-call span, rolled up to trace | Drives cost and latency; spots runaway context or agent loops |
| Latency per span | Every span | Shows whether slowness is retrieval, the model, a tool or your own code |
| Cost | Computed per span, summed per trace | Tokens multiplied by your current price table; lets you report cost per task, tenant or feature |
| User feedback | Attached to trace after the fact | Thumbs up/down, reason, escalation, rephrased question; the most direct quality signal you have |
| Guardrail events | Guardrail span or trace event | Input or output blocked, PII detected, prompt-injection flagged, refusal triggered, human approval requested |
| Context identifiers | Trace attributes | Session ID, pseudonymous user ID, tenant, feature, app version, environment; lets you slice everything else |
PII handling and redaction
Traces are the most sensitive data your AI system produces: questions, retrieved documents and answers can include names, account numbers, medical details or Aadhaar and PAN numbers.
- Redact before export, not after storage. Mask PII in the application or collector pipeline so raw values never reach the tracing backend.
- Capture references, not copies, where you can. Store chunk IDs and scores rather than full text when the source system can resolve them under its own access controls.
- Pseudonymise users. Use an internal ID or hash, not an email address or phone number, as the user attribute.
- Make content capture configurable. Full content in development; masked or sampled content in production, with metadata kept for every request.
The wider controls around this, such as data classification, access to logs and threat modelling, are covered in AI security for enterprises.
A sample trace for an agent request
Here is what a single trace might look like for an IT service-desk agent answering "My VPN keeps disconnecting, can you raise a ticket?". The values are illustrative, not benchmarks.
trace: itdesk-agent  session=s-81f  user=u-3c9
 prompt=triage-v14  app=2.7.0  env=prod
|
+- guardrail.input          12ms  pii=none
+- agent.plan (llm)        840ms  in=1.9k out=120
+- retrieval.kb            210ms  k=5 index=kb-v32
|   +- chunk vpn-faq#4       score=0.82
|   +- chunk vpn-old#2       score=0.79  (stale)
+- tool.lookup_user         95ms  ok
+- tool.create_ticket      410ms  ok id=INC-..
+- agent.respond (llm)    1.2s    in=3.4k out=210
+- guardrail.output         15ms  pass
|
total 2.8s  tokens 5.6k  cost=computed
feedback: thumbs_down "steps were outdated"
Reading it top to bottom, you can already see the likely problem: a stale chunk was retrieved alongside the correct one, and the user flagged outdated steps.
Tools: OpenTelemetry, LangSmith, Langfuse and platform metrics
OpenTelemetry
OpenTelemetry (OTel) is the vendor-neutral, open-source standard for traces, metrics and logs, with SDKs for most languages and a Collector that processes and exports telemetry to many backends. For AI workloads, LLM spans can flow into the same tracing system as your API, database and queue spans, so one trace shows the whole request. The OpenTelemetry project has published semantic conventions for generative AI: shared attribute names for the provider, model, operation type and token usage, plus guidance on capturing prompts and completions. The conventions are still evolving, so check the current specification before standardising attribute names.
LangSmith
LangSmith is LangChain's platform for tracing, datasets and evaluation. It integrates closely with LangChain and LangGraph but also works without them through its SDK. Teams use it to browse trace trees, attach feedback, run online evaluators on sampled traffic and push traces into datasets.
Langfuse
Langfuse is an open-source LLM engineering platform that can be self-hosted or used as a managed service. It provides tracing, prompt management with versions, cost and token tracking, scores and human annotation, and it can ingest OpenTelemetry data. Self-hosting suits banks, insurers and hospitals that must keep prompts and answers in their own environment.
Prometheus, Grafana and CloudWatch
LLM tracing tools are not a replacement for platform monitoring. Prometheus scrapes and stores time-series metrics, Grafana builds dashboards and alerts across many data sources, and Amazon CloudWatch collects metrics, logs and alarms for AWS services, including managed model services such as Amazon Bedrock. Use them for request rate, errors, latency histograms, throttling, pod health and aggregated token and cost counters. If your AI services run on Kubernetes, the platform side is covered in Kubernetes for AI applications.
A common architecture: instrument with OpenTelemetry or a tool SDK, send LLM traces to LangSmith or Langfuse, send platform metrics to Prometheus or CloudWatch, and put key AI metrics on the Grafana dashboards on-call already watches.
If you want to build and instrument these systems hands-on, Cloudsoft's AI, GenAI and Agentic AI course covers RAG, agents, LangSmith, Langfuse and OpenTelemetry tracing as part of the build.
Dashboards and SLOs for AI applications
An SLO (service level objective) is a target for a user-facing indicator over a time window, such as "a given share of requests answered within a latency target over 28 days". The same discipline applies to AI, with a few new indicators. Set targets from your own baseline and with the business owner; the right numbers depend on the use case and risk, so none are suggested here.
| Indicator | How to measure | Notes |
|---|---|---|
| Latency | End-to-end p50/p95/p99 per feature, plus time to first token for streaming | Break down by span so you know whether retrieval, the model or tools are slow |
| Error rate | Failed requests, provider errors, throttling, tool failures, timeouts | Count guardrail blocks separately; a block is not an outage |
| Cost per task | Summed trace cost per completed task, tenant or feature | Per task, not per call: an agent that takes more steps costs more for the same outcome |
| Retrieval hit quality | Share of requests whose top results include a relevant chunk, judged by sampled scoring or later feedback; also empty-retrieval rate | Track by document category and index version |
| Feedback rate | Thumbs-down, escalations and rephrased questions as a share of traffic | Watch the trend; absolute rates depend heavily on UI design |
| Sampled quality scores | Reference-free metrics and calibrated judges run on a sample of traces | Calibrate judges against human labels before trusting them |
Keep one dashboard per AI feature with three rows (reliability, economics, quality), each filterable by prompt version, model and app version, so "what changed?" has a fast answer.
Alerting on quality drift and cost spikes
Good AI alerting follows the same rule as good SRE alerting: page on symptoms that matter to users, and alert on trends rather than single events.
- Quality drift. Alert when the rolling thumbs-down rate, escalation rate or a sampled quality score moves beyond an agreed band relative to its recent baseline, overall and per category. Category matters: a collapse in one document collection can hide inside a stable average.
- Retrieval health. Alert on a rise in empty or low-score retrievals, or an unexpected change in the serving index version.
- Cost spikes. Alert on cost per task and tokens per request, not only total spend. A rise in average agent steps or input tokens usually means a prompt change, a retrieval change that stuffs more context, or an agent stuck in a loop. Hard caps on steps and tokens per request are the safety net behind the alert.
- Guardrail events. A surge in prompt-injection flags or PII detections can mean an attack, a new document source with unexpected content, or a broken detector. Route these to security as well as engineering.
Annotate dashboards with deploys, prompt version changes, model changes and index rebuilds. If prompt and model changes flow through the same pipeline as code, as described in CI/CD for AI applications, those annotations become automatic.
The debugging workflow for a bad answer
When a user reports a wrong answer, do not tweak the prompt first. Work the trace in order.
 complaint / thumbs-down / alert
        |
        v
 1. find the trace (session, user, time)
        |
        v
 2. inspect retrieval: right docs? fresh?
        |  no --> fix index, chunking, filters
        v
 3. inspect prompt as sent: version, context
        |  no --> fix template, instructions
        v
 4. inspect tool calls: args, results, order
        |  no --> fix tool schema, permissions
        v
 5. fix, verify against the same input
        |
        v
 6. add the case to the eval set
- Find the trace. Search by session, pseudonymous user or time window, or open it from the feedback record, which is why feedback must carry the trace ID.
- Inspect retrieval. Were the right documents retrieved, from the right index version, with sensible scores and filters? Was a stale or superseded document ranked high? If the correct information was never in the context, no prompt change will fix it.
- Inspect the prompt as sent. Read the rendered prompt, not the template: version, inserted context, truncation, conflicting history.
- Inspect tool calls. Check tool choice, arguments, results and order; look for swallowed errors and results the model ignored.
- Fix and verify. Change the one thing the trace points to and replay the same input.
- Add it to the eval set. Redact the case and add it to your versioned test set, so the regression gate in CI prevents the same failure from shipping again. This is where observability hands over to evaluation.
For LangGraph-based agents, where state and branching make traces richer, see LangGraph for enterprise AI for how graph nodes map naturally to spans.
Privacy and retention
Trace content is personal data whenever it contains user questions or answers about them. Plan its lifecycle in line with your obligations, which for Indian teams include the Digital Personal Data Protection Act alongside sector regulators and customer contracts.
- Tiered retention. Keep aggregated metrics (tokens, latency, cost, scores) for a long time; keep full prompt and completion content for a shorter, agreed period; keep redacted eval cases indefinitely because they are curated.
- Access control. Restrict and log access to full trace content.
- Data residency. Know where your tracing backend stores data; regulated customers may require self-hosting or a specific region.
- Deletion. Be able to delete a user's traces on request, which is much easier if user IDs are consistent pseudonyms.
An illustrative incident walkthrough
Consider an insurer that runs a claims-help assistant for its customer-support agents, built on RAG over policy documents and a tool that looks up claim status. The engineering team works out of a GCC in Hyderabad.
Detection. On a Monday morning, the quality row of the dashboard shows the thumbs-down rate for the "motor policy" category rising well above its baseline, while latency and error rate stay normal. The drift alert opens a ticket for the on-call engineer.
Triage. Filtering traces by category and time shows the change began after a weekend index rebuild. Retrieval spans in the flagged traces show chunks from both the current and previous motor policy wording, older ones often ranked first.
Root cause. The ingestion job had loaded the new policy PDFs but failed to remove the superseded ones, because a metadata field marking documents as withdrawn was renamed upstream. Version filters confirmed prompt and model were unchanged.
Fix. The team removed the stale documents, fixed the mapping, added a retrieval filter on document status and rebuilt the index. Replayed inputs now cited the current wording.
Prevention. They added the failing questions to the eval set, added an ingestion check that alerts when two active versions of the same policy exist, and added "index version" to the dashboard annotations. Every claim in the post-incident review pointed to a trace.
Running this kind of loop inside a customer's own environment, with their data and their on-call process, is part of what Forward Deployed Engineers do; Cloudsoft's FDE PRO program practises it in its Observe and Improve stations.
Frequently asked questions
What is AI observability?
AI observability is the practice of capturing and analysing what an AI application did on each request, including prompts, model calls, retrieved context, tool calls, tokens, latency, cost, guardrail events and user feedback, so teams can debug bad answers and detect quality and cost drift in production.
How is LLM observability different from APM?
APM tracks whether requests succeed and how fast they are. LLM observability adds what the model saw and produced, which prompt and model versions were used, what was retrieved, which tools were called and whether the answer was good, because a wrong answer usually looks like a successful request.
What is the difference between AI observability and LLM evaluation?
Observability records and surfaces what happened in production through traces, metrics and logs. Evaluation scores whether outputs were correct, grounded and safe, using test sets, metrics, judges and human review. Observability supplies the data and the failing cases; evaluation turns them into scores and regression gates.
Can I use OpenTelemetry for LLM tracing?
Yes. OpenTelemetry can trace LLM calls, retrieval and tool calls as spans alongside the rest of your system, and it has semantic conventions for generative AI that standardise attributes such as model and token usage. The conventions are still evolving, so check the current specification.
Should I use LangSmith or Langfuse?
Both provide LLM tracing, feedback and evaluation. LangSmith integrates closely with LangChain and LangGraph and also works without them. Langfuse is open source and can be self-hosted, which suits teams that must keep prompts and answers inside their own environment. Many teams also export to their existing observability stack via OpenTelemetry.
How do you monitor the cost of an LLM application?
Record input and output tokens on every model-call span, multiply by your current price table to compute cost per span, and sum it per trace. Track cost per task, per tenant and per feature, alert on changes in tokens per request and agent steps, and set hard caps on steps and tokens per request.
How do you handle PII in LLM traces?
Redact or mask personal data before traces leave your application or collector, store document IDs instead of full text where possible, use pseudonymous user IDs, make full content capture configurable, restrict access to trace content and apply a shorter retention period to raw prompts and completions.
Observability is what turns an AI demo into a system an enterprise can operate, debug and trust. Cloudsoft's AI, GenAI and Agentic AI training in Hyderabad takes you from LLM fundamentals through RAG, agents, evaluation and production tracing with hands-on labs, and our SRE training builds the SLO and alerting foundations underneath. Join in our Ameerpet classroom beside Ameerpet Metro or live online; call +91 96660 19191 to book a free demo.