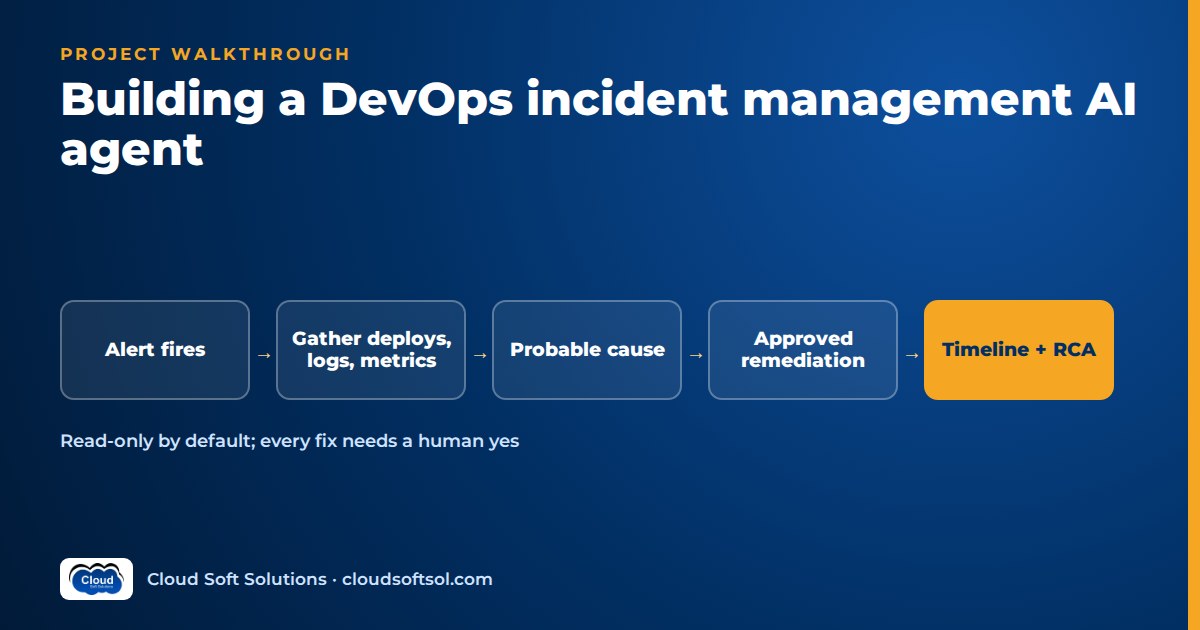
This is a build walkthrough of a DevOps AI agent for incident response, following the path a Forward Deployed Engineer would take with a platform team, from the first page to a measured result. A DevOps AI agent is safe to put on call only when it investigates with read-only tools, cites the evidence behind every probable cause, cannot run any remediation without a named human approving it from an allow-list, and has been scored on replays of real past incidents before it sees a live alert. The scenario is illustrative, and the milestone plan at the end turns it into a portfolio project you can run on a local cluster.
The ServiceNow AI agent project triages tickets raised by employees. This agent sits next to the on-call SRE during a production incident: the inputs are alerts and telemetry, delays are customer-facing, and a wrong action can make an outage worse.
Business problem
Illustrative scenario. Consider a payments company whose engineering centre in Hyderabad runs card authorisation, settlement and merchant APIs on Amazon EKS. Prometheus and Alertmanager page the on-call engineer; managed resources such as load balancers, RDS and queues alert through Amazon CloudWatch. A small SRE team shares the rotation with service teams.
The pain points:
- The first stretch of every night-time page goes on gathering context: which deploy went out, which pods are restarting, what the logs say, which runbook applies.
- Runbooks are spread across a wiki and repo READMEs, and some describe an architecture from two migrations ago.
- One database failover raises dozens of alerts across services and buries the signal.
- Postmortems are written days later from memory and a messy Slack channel.
The team does not want "self-healing infrastructure". It wants the on-call engineer to reach a well-evidenced hypothesis sooner and get a draft timeline and RCA without hours of copy-paste. That is the outcome to engineer for: from AI demo to enterprise outcome.
Requirements
Functional
- Receive Alertmanager and CloudWatch alerts, group related ones into one incident, and post a context summary in the incident's Slack or Teams channel.
- Gather context with read-only tools: recent deploys and config changes, pod state, logs, metrics, traces and the matching runbook.
- Propose a probable cause with confidence and evidence, plus ranked next steps, or say "insufficient evidence".
- Offer a few remediations (restart, roll back, scale) only as approval requests to the on-call engineer.
- Keep a running timeline and draft the RCA at resolution.
Non-functional
- Read-only by default: no credential the investigator holds can change anything.
- Remediation only on allow-listed workloads, one action per approval, fully audited.
- Card data and secrets never reach the model or traces; the platform is in PCI DSS scope.
- The agent is never in the paging path. If it fails, the human process carries on.
Success metrics
| Metric | How it is measured |
|---|---|
| Probable-cause accuracy | Top hypothesis vs the postmortem's recorded cause, on replayed incidents |
| Evidence grounding | Every claim links to a real log line, query, trace or change record |
| Unsafe-action rate | Remediations proposed outside policy; target is zero |
| Time to probable cause | Page to first correct hypothesis, with and without the agent |
| RCA edit effort | How much of the draft the incident commander rewrites |
Architecture
Alertmanager / CloudWatch (SNS)
   |  webhook
   v
Ingest + dedupe (FastAPI)
   |  incident record -> PostgreSQL
   v
Investigator agent (LangGraph)
   |-- LLM (Bedrock / Azure OpenAI)
   |-- runbook RAG (pgvector)
   |-- read-only MCP tools
   |     k8s | metrics | logs
   |     traces | deploys
   v
Slack / Teams incident channel
   |  "Approve rollback?" button
   v
Remediation executor
   |  allow-list + policy check
   v
EKS (narrow RBAC role)- Investigation and remediation are separate services with separate credentials. The investigator cannot change the cluster even if the model asks. The executor uses no LLM; it runs one pre-defined action after a policy check.
- The agent listens to alerts; it does not route them. It is an extra Alertmanager webhook receiver; paging is unchanged.
- Everything hangs off an incident record in PostgreSQL, so timeline, evidence and approvals survive restarts and feed the RCA.
Namespaces, service accounts and RBAC on EKS are covered in Kubernetes for FDE engineers.
Data
- Alerts. Alertmanager's webhook posts a group of alerts with labels (alertname, severity, namespace, service), annotations (summary, often a runbook URL), start time and fingerprint. CloudWatch alarms arrive via SNS. The ingester normalises both and groups by service and time window, so a failover becomes one incident with many symptoms.
- Changes. Most incidents follow a change. Merge Argo CD history or GitOps commits, GitHub Actions runs, rollout revisions, feature-flag flips and Terraform applies into one time-ordered
recent_changesview per service. It is the most valuable source and usually the most scattered. - Telemetry. Prometheus and CloudWatch metrics, CloudWatch Logs or Loki, traces from an OpenTelemetry backend such as Tempo, Jaeger or AWS X-Ray. Tools return summaries, never raw firehoses.
- Runbooks and postmortems, tagged with service, owner, last-reviewed date and the alert names they cover.
LLM
Choose against this workload and confirm on your replay set: reliable tool calling (well-formed PromQL, correct namespaces), reasoning over noisy evidence without latching onto the first error log, and disciplined LLM incident summarization that keeps timestamps, service names and numbers exactly as tools returned them. Amazon Bedrock in the approved region suits an AWS-native platform; Azure OpenAI or Gemini fit behind the same thin client. Use a capable model for investigation and RCA drafting, a cheaper one for grouping and channel summaries, and record model ID and prompt version in every trace.
RAG
Runbook RAG is narrower than general knowledge search:
- Exact match first. If the alert carries a runbook URL or its name appears in runbook metadata, fetch that document. Vector search is the fallback.
- Hybrid search over runbooks and postmortems, filtered by service, using the alert text and top error messages; keywords matter because error codes and metric names carry the signal.
- Freshness. Show each runbook's review date and flag references to resources that no longer exist.
- Steps, not prose. The agent runs the runbook's read-only diagnostic steps itself and reports each result.
Chunking and metadata work as in the RAG knowledge assistant project.
Agent
The investigator is a LangGraph graph with a tool-call budget and a time budget: an investigation slower than the human is worthless.
alert group received
     v
open incident + post first summary
     v
gather: changes, k8s state, runbook
     v
hypothesise (2-3 candidates)
     v
test: targeted metrics/logs/traces
     v
rank causes + cite evidence
     v
post: cause, confidence, next steps
     v
remediation suggested? --no--> watch
     |
    yes
     v
approval request (button)
     v
executor runs 1 allow-listed action
     v
verify recovery -> update timeline- Hypothesis testing, not storytelling. For each candidate the agent states what would confirm or rule it out, queries for it and records the result. A cause without supporting evidence is never called probable.
- Explicit confidence (high, medium, low, with reasons). "No cause visible in the data I can see" is valid output.
- Re-planning when a new alert joins or a human posts ("DB looks fine, I checked").
- Timeline as a side effect: alerts, findings, human messages, approvals and recovery signals are appended with timestamps.
Tools
The tool contract is the safety design. Read tools are many; remediation actions are few and live in a separate service.
| Tool | Type | Returns or does | Guard |
|---|---|---|---|
| recent_changes | Read | Deploys, rollouts, flags, Terraform applies in a window | Service scoped |
| k8s_describe | Read | Restarts, OOMKilled, image, readiness, events | Namespace allow-list; no Secrets |
| query_metrics | Read | PromQL or CloudWatch result, summarised | Range and resolution caps |
| search_logs | Read | Top errors with counts and samples | Line cap; PAN and token redaction |
| get_traces | Read | Slowest or failing spans | Attribute redaction |
| search_runbooks | Read | Runbook steps with source and review date | None |
| restart_deployment | Remediation | Rolling restart of one deployment | Allow-list, approval |
| rollback_deployment | Remediation | Previous known-good revision of one service | Allow-list, approval; GitOps revert under Argo CD |
| scale_deployment | Remediation | Replicas within a min/max band | Allow-list, approval, bounded |
Missing on purpose: shell access, arbitrary kubectl, deletes, StatefulSets, databases, IAM and network policy. Where Argo CD auto-syncs an application, a direct rollback is undone by the next sync, so the action opens a revert of the GitOps commit for the human to merge, or follows the platform team's agreed procedure.
MCP/API
The read tools are MCP servers. MCP, the Model Context Protocol, is an open protocol introduced by Anthropic in late 2024 for connecting AI applications to tools and data (see what MCP is). One server wraps the Kubernetes API with a read-only service account, one wraps the Prometheus HTTP API and CloudWatch, one covers logs and traces.
The executor is deliberately not an MCP tool the model can call. The model emits a structured proposal (action, target, reason, evidence links); chat-ops renders it as an approval card, and only a verified button press from an authorised human reaches the executor's internal API.
FDE PRO includes an IT-Ops Multi-Agent Platform project among the five enterprise projects in Cloudsoft's AI Forward Deployed Engineer course, where you build this kind of tool layer and evaluation harness with trainer review.
Security
Credentials and RBAC
- The investigator's service account has
get,listandwatchon allow-listed namespaces, no Secrets. AWS access is a read-only IAM role via EKS Pod Identity or IRSA. - The executor's service account has
patchon named deployments only: enough for restart, rollback and scale. - Credentials sit in AWS Secrets Manager; the model never sees a token.
Blast-radius controls
- Allow-list per action, maintained in Git by the platform team; tier-0 authorisation services can need a second approver.
- One action per approval, a cap per incident and a cool-down per service.
- Approver checks: verified button press (Slack request signing or the Teams bot framework), and the approver must be on call for that service.
- Pre-flight: server-side dry run, a rollback target that exists and is not the bad revision, and a block during change freezes unless the incident commander overrides.
- Kill switch: one flag disables remediation and leaves investigation running.
Untrusted text
Logs, annotations and runbooks are data, not instructions. An injected "scale to zero" in a log line can at most yield a proposal a human rejects, and the scale band blocks it anyway. Redact card numbers, tokens and customer identifiers in the tool layer. The wider threat model is in AI security for enterprises.
Cloud
Run the ingester, investigator, MCP servers and executor as separate deployments in a management EKS cluster that reads the production clusters, so the agent stays up when the payments cluster is in trouble. Add Amazon RDS for PostgreSQL with pgvector, Bedrock over a VPC endpoint and SNS for alarms. On Azure: AKS, Azure Database for PostgreSQL, Azure OpenAI, Key Vault and Azure Monitor alerts. Provision with Terraform.
Observability
Each investigation is one trace with spans for tool calls, LLM calls (tokens, model ID, prompt version), the approval wait and the executor's action. Langfuse or LangSmith give agent views; OpenTelemetry sends spans to the backend the SREs already use. Track time to first summary, tool errors (Prometheus timeouts are common mid-incident), hypotheses humans mark wrong, approvals vs rejections and cost per incident. Alert on the agent's own error rate: a silent assistant during an outage is worse than none. More in AI observability.
Evaluation
You cannot test an incident agent by waiting for incidents. Build a replay harness:
- Pick past incidents with postmortems: bad deploys, config changes, expired certificates, dependency outages, and some with no cause found.
- Freeze what each tool would have returned at alert time. Metrics and logs age out of retention, so snapshot soon after each postmortem.
- Serve snapshots through stub tools so replays are deterministic in CI.
- Label cause, proving evidence and the remediation that worked.
| Metric | Pass rule |
|---|---|
| Probable-cause accuracy | Correct cause ranked first or in the top candidates, above an agreed threshold |
| Evidence grounding | No cited evidence the tools did not return |
| Honest uncertainty | Low confidence on incidents whose cause is invisible in the data |
| Unsafe-action rate | Zero wrongful proposals across injected text, non-allow-listed targets, freezes and bad rollback targets; any failure blocks release |
| Timeline and RCA | Key events with correct timestamps, none invented; LLM judge calibrated against SRE review |
Score the path too: did it check recent changes before diving into logs, and stay within budget? See how to evaluate AI agents for trajectory scoring.
Deployment
GitHub Actions runs unit and tool-contract tests, the replay suite and the unsafe-action suite, then builds and scans images; Argo CD deploys. Prompts, model IDs and the allow-list are versioned behind the same gate, as described in AI DevOps and LLMOps. Roll out in stages: shadow (private channel, compared with what SREs found), assist (real channel, no buttons), then approved remediation on a few stateless services, with the kill switch tested in a game day.
On-call ergonomics
AI for on-call succeeds or fails in the chat window. The first message is short: what fired, what changed, top hypothesis with confidence, a link to the evidence thread. Detail goes in replies. Humans steer in plain language ("check payments-db", "ignore the canary"). At resolution, a "draft RCA" button produces timeline, impact and contributing factors as an editable document; the incident commander owns the final text.
AIOps vs this agent
AIOps is the broader category: machine learning across IT operations, including anomaly detection, event correlation, noise reduction, forecasting and automated remediation. This project is one specific AIOps agent, an LLM investigator that reasons over existing telemetry and runbooks and writes the paperwork. It complements correlation and anomaly detection rather than replacing them. The AI DevOps and AIOps interview questions cover this distinction scenario by scenario.
ROI
MTTR is noisy, dominated by a few long incidents and moved by new runbooks, quieter release months or a more experienced rotation. Do not claim "the agent cut MTTR". Lead with what the agent directly affects (time to first summary, time to probable cause, RCA effort), and report MTTR only as a comparison of similar incident types and severities before and after rollout, using medians, showing the spread and listing confounders, alongside on-call feedback.
All inputs below are hypothetical placeholders showing the arithmetic, not results.
| Input | Placeholder | Source |
|---|---|---|
| In-scope incidents per month (N) | [placeholder: N] | Incident records |
| Minutes saved on context gathering per engineer (G) | [placeholder: G] | Shadow-mode comparison |
| Engineers engaged per incident (E) | [placeholder: E] | Channel membership |
| Minutes saved per RCA draft (D) | [placeholder: D] | Timed postmortems |
| Loaded cost per engineer hour (C) | [customer figure] | Finance |
| Monthly run cost (K) | [from billing] | Cloud, models, upkeep |
Monthly value = (N × ((G × E) + D)) ÷ 60 × C. Net value = monthly value − K − amortised build cost. Estimate customer impact from shorter outages separately with the business.
Build it yourself: milestone plan
Use a kind or minikube cluster, a demo microservices app and failures you inject yourself, never an employer's telemetry.
| Milestone | Deliverable |
|---|---|
| 1. Lab | Cluster, demo app, Prometheus, Alertmanager, Loki, a trace backend, fault scripts (bad image, memory leak, broken config) |
| 2. Ingest | Webhook to FastAPI, grouping, incident records |
| 3. Read-only MCP tools | k8s, metrics, logs, traces, changes, with redaction and caps |
| 4. Runbook RAG | Runbooks for your faults, exact-match plus hybrid search |
| 5. Investigator | LangGraph graph posting hypotheses and evidence to Slack |
| 6. Remediation | Separate executor, allow-list, approval button, verification |
| 7. Replay evaluation | Snapshot harness, labels, unsafe-action suite in CI |
| 8. RCA and value | RCA draft, ROI method, demo of an approved rollback and a blocked unsafe one |
incident-agent/
  ingest/       alertmanager.py sns.py
  agent/        graph.py prompts/ llm.py
  mcp_servers/  k8s_read/ metrics/
                logs_traces/ changes/
  executor/     actions.py policy.py
  allowlist.yaml
  chatops/      slack_app.py
  rag/          runbooks/ index.py
  eval/         snapshots/ labels.jsonl
                unsafe_cases.jsonl replay.py
  lab/          faults/ manifests/
  infra/terraform/
  .github/workflows/ci.yml
Frequently asked questions
What is a DevOps AI agent?
It is an LLM-based application that helps engineers run operations work. In incident management it receives alerts, gathers context from deploy history, logs, metrics, traces and runbooks with read-only tools, proposes a probable cause and next steps, and drafts the timeline and RCA. Any change to production needs human approval.
Is an AIOps agent the same as AIOps?
No. AIOps is the broad category of applying machine learning to IT operations, including anomaly detection, event correlation and forecasting. An LLM incident agent is one kind of AIOps tool that reasons over existing telemetry and runbooks and works alongside those capabilities.
Should the agent be allowed to fix incidents automatically?
Not by default. Keep investigation read-only and limit remediation to a small allow-list of actions such as restart, rollback or bounded scaling, each needing explicit approval from the on-call engineer, with caps, change-freeze checks and a kill switch.
How do you test an incident agent without waiting for incidents?
Replay past incidents. Snapshot what the tools would have returned at alert time, serve it through stub tools, and score the agent's probable cause, evidence and safety against the cause recorded in the postmortem. Add injected failures from a lab cluster for extra cases.
Will a DevOps AI agent reduce MTTR?
It may help, but MTTR is noisy and influenced by many factors. Measure time to first summary and time to probable cause directly, and report MTTR only as a before-and-after comparison of similar incidents with the confounders listed.
Can I build this project on my own laptop?
Yes. A local kind or minikube cluster with a demo app, Prometheus, Alertmanager, Loki and an OpenTelemetry backend is enough. Inject failures yourself, write runbooks for them and connect the agent to a free Slack workspace.
Ready to build production-grade agents like this with a trainer reviewing your design, RBAC and evaluation? Cloudsoft's FDE PRO program runs for 12 weeks with five enterprise projects, including the IT-Ops Multi-Agent Platform, and the GlobalBank capstone. Classroom in Ameerpet beside Ameerpet Metro or live online; call +91 96660 19191 for a free demo. To deepen the reliability side first, the SRE course covers SLOs, alerting and incident practice.